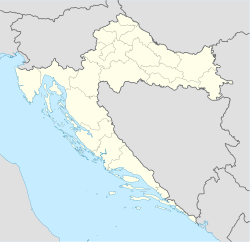
Ražanac
Appearance
Ražanac | |
|---|---|
Municipality | |
 City walls and harbour | |
| Coordinates: 44°16′55″N 15°20′53″E / 44.282°N 15.3481°E | |
| Country | |
| County | Zadar |
| Area | |
• Municipality | 68.9 km2 (26.6 sq mi) |
| • Urban | 12.5 km2 (4.8 sq mi) |
| Population (2021)[2] | |
• Municipality | 2,746 |
| • Density | 40/km2 (100/sq mi) |
| • Urban | 883 |
| • Urban density | 71/km2 (180/sq mi) |
| Website | opcina-razanac |
Ražanac is a village and municipality in the Zadar County in Croatia.
Demographics
[edit]According to the 2011 census, the municipality had 2,940 inhabitants,[3] 98% of which were Croats.[4]
In 2021, the municipality had 2,746 residents in the following 6 settlements:[2]
- Jovići, population 327
- Krneza, population 164
- Ljubač, population 402
- Radovin, population 527
- Ražanac, population 883
- Rtina, population 443
Ražanac: Population trends 1857–2021
| population | 1289 | 1100 | 1413 | 1687 | 1843 | 2103 | 2590 | 2825 | 3618 | 3956 | 3966 | 3767 | 3287 | 3805 | 3107 | 2940 | 2746 |
| 1857 | 1869 | 1880 | 1890 | 1900 | 1910 | 1921 | 1931 | 1948 | 1953 | 1961 | 1971 | 1981 | 1991 | 2001 | 2011 | 2021 |
References
[edit]Wikimedia Commons has media related to Ražanac.
- ^ Register of spatial units of the State Geodetic Administration of the Republic of Croatia. Wikidata Q119585703.
- ^ a b "Population by Age and Sex, by Settlements" (xlsx). Census of Population, Households and Dwellings in 2021. Zagreb: Croatian Bureau of Statistics. 2022.
- ^ "Population by Age and Sex, by Settlements, 2011 Census: Ražanac". Census of Population, Households and Dwellings 2011. Zagreb: Croatian Bureau of Statistics. December 2012.
- ^ "Population by Ethnicity, by Towns/Municipalities, 2011 Census: County of Zadar". Census of Population, Households and Dwellings 2011. Zagreb: Croatian Bureau of Statistics. December 2012.


