
Portola, California
City of Portola | |
|---|---|
.jpg) Union Pacific trains in Portola | |
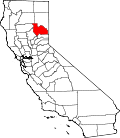
 Location in Plumas County and the state of California | |
 City of Portola Location in the United States | |
| Coordinates: 39°48′37″N 120°28′11″W / 39.81028°N 120.46972°W | |
| Country | |
| State | |
| County | Plumas |
| Incorporated | May 16, 1946[1] |
| Area | |
• Total | 5.41 sq mi (14.00 km2) |
| • Land | 5.41 sq mi (14.00 km2) |
| • Water | 0.00 sq mi (0.00 km2) 0% |
| Elevation | 4,856 ft (1,480 m) |
| Population | |
• Total | 2,100 |
| • Density | 390/sq mi (150/km2) |
| Time zone | UTC-8 (Pacific (PST)) |
| • Summer (DST) | UTC-7 (PDT) |
| ZIP codes | 96122, 96129 |
| Area code | 530 |
| FIPS code | 06-58352 |
| GNIS feature IDs | 1659425, 2411473 |
| Website | www |
Portola (/pɔːrˈtoʊlə/ por-TOH-lə) is the only incorporated city in Plumas County, California, United States. The population was 2,100 at the 2020 census, down from 2,104 at the 2010 census. Portola is located on the Middle Fork of the Feather River and was named after Spanish explorer Gaspar de Portolá,[5] although he did not explore this area.
Portola is a crew change site on the Western Pacific Railroad (now Union Pacific Railroad) Feather River Route over the Sierra Nevada. The city is also home to the Western Pacific Railroad Museum (formerly Portola Railroad Museum), one of the largest railroad museums in the Western United States. The museum is famous for its Run A Locomotive program, where the public can participate in a "fantasy experience" program allowing them to run a railroad locomotive on the museum grounds. The railroad tradition also extends to a yearly local event called “Railroad Days”.
Portola was in the national media spotlight in 1996–1997 when a conflict occurred between the local community and the Department of Fish and Game over how to deal with an invasive species of northern pike in Lake Davis. The lake was chemically treated in 1997 to eradicate the fish, but they reappeared in 1999. In early September 2007, the California Department of Fish and Game eradicated the pike[6] using CFT Legumine, a new liquid formulation of rotenone.[7]
Geography
[edit].jpg)
The town of Portola sits along both sides of the middle fork of the Feather River, in Plumas County, on the upper eastern part of Northern California. Portola lies off the eastern slopes of the Sierra Nevada. The local landscape is best described as being part of the Feather River drainage, which flows westward down the Feather River Canyon.
Portola is located at 39°48′37″N 120°28′11″W / 39.810151°N 120.469843°W.[8]
According to the United States Census Bureau, the city has a total area of 5.4 square miles (14 km2), all of it land.
Portola lies on the Middle Fork of the Feather River in the Sierra Nevada mountain range. The headwaters of the Middle Fork of the Feather River originate just east of Portola in Sierra Valley, near Beckwourth.[9]
Lake Davis is located approximately 6 miles (9.7 km) north of Portola, and is a popular fishing and camping location. About 15 miles (24 km) to the west and southwest of Portola, Plumas-Eureka State Park and Lakes Basin Recreation Area feature granite peaks, glacial lakes, streams, and temperate coniferous forests, which make them popular destinations for outdoor enthusiasts.[10][11]
Being on the eastern slopes of the Sierra Nevada, Portola has a continental Mediterranean climate (Köppen: Dsb) with dry summers characterized by extreme diurnal temperature swings, and cold (though not severe) and snowy winters. Frosts occur on 218 mornings per year. Extreme cold is rare and temperatures below 0 °F (−17.8 °C) are observed on only 2.6 mornings per winter in an average year.[12] During the summer, daytime temperatures of 100 °F (37.8 °C) are reached on average only once every two years.[12]
Climate
[edit]| Climate data for Portola, California (1991–2020 normals, extremes 1915–present, snowfall from XMACIS (2006-2025) | |||||||||||||
|---|---|---|---|---|---|---|---|---|---|---|---|---|---|
| Month | Jan | Feb | Mar | Apr | May | Jun | Jul | Aug | Sep | Oct | Nov | Dec | Year |
| Record high °F (°C) | 68 (20) |
72 (22) |
80 (27) |
86 (30) |
94 (34) |
110 (43) |
110 (43) |
107 (42) |
100 (38) |
92 (33) |
82 (28) |
72 (22) |
110 (43) |
| Mean maximum °F (°C) | 58 (14) |
60 (16) |
67 (19) |
75 (24) |
84 (29) |
91 (33) |
96 (36) |
95 (35) |
90 (32) |
82 (28) |
68 (20) |
56 (13) |
97 (36) |
| Mean daily maximum °F (°C) | 43.0 (6.1) |
46.0 (7.8) |
51.0 (10.6) |
57.7 (14.3) |
67.0 (19.4) |
77.2 (25.1) |
86.4 (30.2) |
85.2 (29.6) |
78.8 (26.0) |
66.4 (19.1) |
52.5 (11.4) |
42.1 (5.6) |
62.8 (17.1) |
| Daily mean °F (°C) | 31.1 (−0.5) |
33.5 (0.8) |
37.9 (3.3) |
43.4 (6.3) |
51.0 (10.6) |
58.7 (14.8) |
65.5 (18.6) |
63.9 (17.7) |
58.0 (14.4) |
48.1 (8.9) |
38.3 (3.5) |
30.5 (−0.8) |
46.7 (8.1) |
| Mean daily minimum °F (°C) | 19.3 (−7.1) |
20.9 (−6.2) |
24.9 (−3.9) |
29.1 (−1.6) |
35.1 (1.7) |
40.1 (4.5) |
44.6 (7.0) |
42.6 (5.9) |
37.1 (2.8) |
29.7 (−1.3) |
24.1 (−4.4) |
18.9 (−7.3) |
30.5 (−0.8) |
| Mean minimum °F (°C) | 4 (−16) |
6 (−14) |
13 (−11) |
19 (−7) |
26 (−3) |
30 (−1) |
35 (2) |
34 (1) |
28 (−2) |
21 (−6) |
12 (−11) |
2 (−17) |
−2 (−19) |
| Record low °F (°C) | −24 (−31) |
−21 (−29) |
−12 (−24) |
3 (−16) |
13 (−11) |
20 (−7) |
22 (−6) |
19 (−7) |
12 (−11) |
3 (−16) |
−6 (−21) |
−28 (−33) |
−28 (−33) |
| Average precipitation inches (mm) | 4.16 (106) |
3.93 (100) |
3.57 (91) |
1.55 (39) |
1.15 (29) |
0.52 (13) |
0.34 (8.6) |
0.30 (7.6) |
0.44 (11) |
1.07 (27) |
2.03 (52) |
4.28 (109) |
23.34 (593.2) |
| Average snowfall inches (cm) | 17.3 (44) |
15.8 (40) |
25.5 (65) |
3.6 (9.1) |
0.5 (1.3) |
0.0 (0.0) |
0.0 (0.0) |
0.0 (0.0) |
0.2 (0.51) |
0.7 (1.8) |
4.1 (10) |
17.8 (45) |
85.5 (216.71) |
| Average precipitation days (≥ 0.01 in) | 8.7 | 8.5 | 8.1 | 6.0 | 5.7 | 2.6 | 1.0 | 1.2 | 1.8 | 3.5 | 6.2 | 8.4 | 61.7 |
| Average snowy days (≥ 0.1 in) | 3.0 | 2.7 | 2.0 | 0.7 | 0.2 | 0.0 | 0.0 | 0.0 | 0.1 | 0.2 | 1.5 | 2.9 | 13.3 |
| Source: NOAA[13][14] | |||||||||||||
Demographics
[edit]| Census | Pop. | Note | %± |
|---|---|---|---|
| 1950 | 2,261 | — | |
| 1960 | 1,874 | −17.1% | |
| 1970 | 1,625 | −13.3% | |
| 1980 | 1,885 | 16.0% | |
| 1990 | 2,193 | 16.3% | |
| 2000 | 2,227 | 1.6% | |
| 2010 | 2,104 | −5.5% | |
| 2020 | 2,100 | −0.2% | |
| U.S. Decennial Census[15] | |||
2020
[edit]The 2020 United States census reported that Portola had a population of 2,100. The population density was 388.4 inhabitants per square mile (150.0/km2). The racial makeup of Portola was 77.5% White, 0.4% African American, 1.8% Native American, 1.0% Asian, 0.7% Pacific Islander, 6.0% from other races, and 12.6% from two or more races. Hispanic or Latino of any race were 19.1% of the population.[16]
The census reported that 99.7% of the population lived in households, 0.3% lived in non-institutionalized group quarters, and no one was institutionalized.[16]
There were 910 households, out of which 30.1% included children under the age of 18, 40.8% were married-couple households, 7.7% were cohabiting couple households, 29.9% had a female householder with no partner present, and 21.6% had a male householder with no partner present. 32.2% of households were one person, and 16.0% were one person aged 65 or older. The average household size was 2.3.[16] There were 563 families (61.9% of all households).[17]
The age distribution was 23.3% under the age of 18, 6.1% aged 18 to 24, 25.3% aged 25 to 44, 25.0% aged 45 to 64, and 20.2% who were 65 years of age or older. The median age was 41.0 years. For every 100 females, there were 95.7 males.[16]
There were 1,077 housing units at an average density of 199.2 units per square mile (76.9 units/km2), of which 910 (84.5%) were occupied. Of these, 57.1% were owner-occupied, and 42.9% were occupied by renters.[16]
In 2023, the US Census Bureau estimated that the median household income was $42,385, and the per capita income was $21,378. About 26.1% of families and 27.3% of the population were below the poverty line.[18]
2010
[edit]The 2010 United States Census[19] reported that Portola had a population of 2,104. The population density was 389.1 inhabitants per square mile (150.2/km2). The racial makeup of Portola was 1,762 (83.7%) White, 13 (0.6%) African American, 54 (2.6%) Native American, 12 (0.6%) Asian, 1 (0.0%) Pacific Islander, 198 (9.4%) from other races, and 64 (3.0%) from two or more races. Hispanic or Latino of any race were 342 persons (16.3%).
The Census reported that 2,080 people (98.9% of the population) lived in households, 0 (0%) lived in non-institutionalized group quarters, and 24 (1.1%) were institutionalized.
There were 887 households, out of which 278 (31.3%) had children under the age of 18 living in them, 378 (42.6%) were opposite-sex married couples living together, 114 (12.9%) had a female householder with no husband present, 53 (6.0%) had a male householder with no wife present. There were 68 (7.7%) unmarried opposite-sex partnerships, and 4 (0.5%) same-sex married couples or partnerships. 286 households (32.2%) were made up of individuals, and 113 (12.7%) had someone living alone who was 65 years of age or older. The average household size was 2.34. There were 545 families (61.4% of all households); the average family size was 2.92.
The population was spread out, with 502 people (23.9%) under the age of 18, 198 people (9.4%) aged 18 to 24, 462 people (22.0%) aged 25 to 44, 638 people (30.3%) aged 45 to 64, and 304 people (14.4%) who were 65 years of age or older. The median age was 39.8 years. For every 100 females, there were 93.4 males. For every 100 females age 18 and over, there were 89.8 males.
There were 1,134 housing units at an average density of 209.7 per square mile (81.0/km2), of which 482 (54.3%) were owner-occupied, and 405 (45.7%) were occupied by renters. The homeowner vacancy rate was 6.8%; the rental vacancy rate was 21.0%. 1,156 people (54.9% of the population) lived in owner-occupied housing units and 924 people (43.9%) lived in rental housing units.
Government
[edit]The city is governed by a five-member council. Council members serve staggered four-year terms. The council chooses the mayor and mayor pro tem.[20]
In the California State Legislature, Portola is in the 1st senatorial district, represented by Republican Megan Dahle,[21] and the 1st Assembly district, represented by Republican Heather Hadwick.[22]
In the United States House of Representatives, Portola is in California's 1st congressional district, represented by Republican Doug LaMalfa.[23]
Education
[edit]The school district is Plumas Unified School District.[24]
References
[edit]- ^ "California Cities by Incorporation Date". California Association of Local Agency Formation Commissions. Archived from the original (Word) on November 3, 2014. Retrieved August 25, 2014.
- ^ "2019 U.S. Gazetteer Files". United States Census Bureau. Retrieved July 1, 2020.
- ^ "Portola". Geographic Names Information System. United States Geological Survey, United States Department of the Interior. Retrieved December 30, 2014.
- ^ "US Census Bureau". www.census.gov. Retrieved April 12, 2024.
- ^ Brown, Thomas P. (May 30, 1940). "Over the Sierra". Indian Valley Record. p. 3. Retrieved May 7, 2015.
- ^ "Lake Davis Pike Eradication Project Update". California Department of Fish and Game. October 19, 2007. Archived from the original on October 30, 2007. Retrieved November 17, 2020.
- ^ "2007 Lake Davis Pike Eradication Project: Short-Term Impacts on the Local Economy and Real Estate Values" (PDF). California Department of Fish and Game. December 2008. Archived from the original (PDF) on April 11, 2009. Retrieved November 17, 2020.
- ^ "US Gazetteer files: 2010, 2000, and 1990". United States Census Bureau. February 12, 2011. Retrieved April 23, 2011.
- ^ Plumas National Forest - About the Forest
- ^ Plumas Eureka State Park Association - Blairsden, CA
- ^ Communities: Lakes Basin, Plumas County Northern California
- ^ a b Climatography of the United States No. 20 – Station: PORTOLA, CA (047085)
- ^ "NOWData - NOAA Online Weather Data". National Oceanic and Atmospheric Administration. Retrieved December 9, 2023.
- ^ "Summary of Monthly Normals 1991-2020". National Oceanic and Atmospheric Administration. Retrieved December 9, 2023.
- ^ "Census of Population and Housing". Census.gov. Retrieved June 4, 2015.
- ^ a b c d e "Portola city, California; DP1: Profile of General Population and Housing Characteristics - 2020 Census of Population and Housing". US Census Bureau. Retrieved May 31, 2025.
- ^ "Portola city, California; P16: Household Type - 2020 Census of Population and Housing". US Census Bureau. Retrieved May 31, 2025.
- ^ "Portola city, California; DP03: Selected Economic Characteristics - 2023 ACS 5-Year Estimates Comparison Profiles". US Census Bureau. Retrieved May 31, 2025.
- ^ "2010 Census Interactive Population Search: CA - Portola city". U.S. Census Bureau. Archived from the original on July 15, 2014. Retrieved July 12, 2014.
- ^ "Portola City Council". City of Portola. Archived from the original on December 31, 2014. Retrieved December 30, 2014.
- ^ "Senators". State of California. Retrieved March 10, 2013.
- ^ "Members Assembly". State of California. Retrieved March 2, 2013.
- ^ "California's 1st Congressional District - Representatives & District Map". Civic Impulse, LLC. Retrieved March 3, 2013.
- ^ Geography Division (December 18, 2020). 2020 CENSUS - SCHOOL DISTRICT REFERENCE MAP: Plumas County, CA (PDF) (Map). U.S. Census Bureau. Retrieved March 22, 2025. - Text list
External links
[edit]- Official website

- Portola Reporter - Local newspaper No longer publishing
- Feather River Rail Society
- Western Pacific Railroad Museum at Portola
- Article about the Portola Railroad Museum
- http://www.portolarailroaddays.com
- http://www.discoverplumascounty.com
- https://www.easternplumaschamber.com
| Mountains |
| |||||||||||
|---|---|---|---|---|---|---|---|---|---|---|---|---|
| Passes | ||||||||||||
| Rivers | ||||||||||||
| Lakes | ||||||||||||
| Protected areas |
| |||||||||||
| Communities | ||||||||||||
| Ski areas | ||||||||||||
| Trails | ||||||||||||

| International | |
|---|---|
| National | |
| Geographic | |