
File:LinearChirpMatlab.png

Size of this preview: 800 × 521 pixels. Other resolutions: 320 × 208 pixels | 640 × 417 pixels | 1,024 × 667 pixels | 1,276 × 831 pixels.
Original file (1,276 × 831 pixels, file size: 35 KB, MIME type: image/png)
| This is a file from the Wikimedia Commons. Information from its description page there is shown below. Commons is a freely licensed media file repository. You can help. |
Summary
| Description |
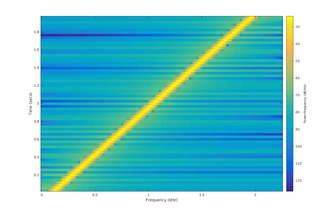
English: Spectrogram of a linear chirp. The spectrogram plot demonstrates the linear rate of change in frequency as a function of time, in this case from 0.1 to 2 kHz over the course of 2 seconds. The intensity of the plot is proportional to the energy content in the signal at the indicated frequency and time. |
| Date | |
| Source | Own work |
| Author | Mark Stenglein |
Licensing
| I, the copyright holder of this work, release this work into the public domain. This applies worldwide. In some countries this may not be legally possible; if so: I grant anyone the right to use this work for any purpose, without any conditions, unless such conditions are required by law. |
File history
Click on a date/time to view the file as it appeared at that time.
| Date/Time | Thumbnail | Dimensions | User | Comment | |
|---|---|---|---|---|---|
| current | 07:10, 3 November 2016 | | 1,276 × 831 (35 KB) | Ocelotsloth | {{Information |Description ={{en|1=Spectrogram of a linear chirp. The spectrogram plot demonstrates the linear rate of change in frequency as a function of time, in this case from 0.1 to 2 kHz over the course of 2 seconds. The intensity of the plot... |
File usage
The following page uses this file:
Global file usage
The following other wikis use this file:
- Usage on ar.wikipedia.org
- Usage on ca.wikipedia.org
- Usage on fa.wikipedia.org
- Usage on he.wikipedia.org
- Usage on zh.wikipedia.org